

Technology is enhancing healthcare in Nigeria, as demonstrated by the use of GIS mapping in Kano State to improve vaccinators’ performance and address the resurgence of polio cases. GRID3 has built on the success of the GIS intervention introduced in 2012, utilising maps for effective polio and non-polio campaigns in the state.
In March 2013, a group of 170 vaccination team supervisors gathered at the Sharada Primary Healthcare Centre (PHC) in Kano Municipal Local Government Area (LGA), Kano State to collect vaccines and toolkits for the implementation of the intensified supplementary immunisation activities (SIAs) in the LGA. With several years of immunisation campaign experience under their belts, Shamsiyya Ibrahim, 35, and Ummi Abubakar, 29, two of the supervisors at the PHC, were no strangers to the challenges of conducting immunisation campaigns in the state.
However, this four-day polio immunisation exercise was different because it was one of the first of many to be carried out with the aid of a geospatial information system (GIS). The GIS is a technology that maps out locations that require vaccines and how many people must be vaccinated in each location. By the end of the campaign, each team had successfully met their target of attending to 80 to 120 households per day. According to Shamsiyya, in the past, they often had to conduct frequent community visits after each vaccination campaign due to poor implementation.
Introducing GIS Mapping to Kano State
In 2012, the Public Health Services and Solutions (PHSS) in partnership with the National Primary Health Care Development Agency (NPHCDA) and the World Health Organization (WHO), with support from the Bill & Melinda Gates Foundation, introduced the GIS to collect geospatial data in Kano State and in 10 other polio high-risk states in Nigeria.


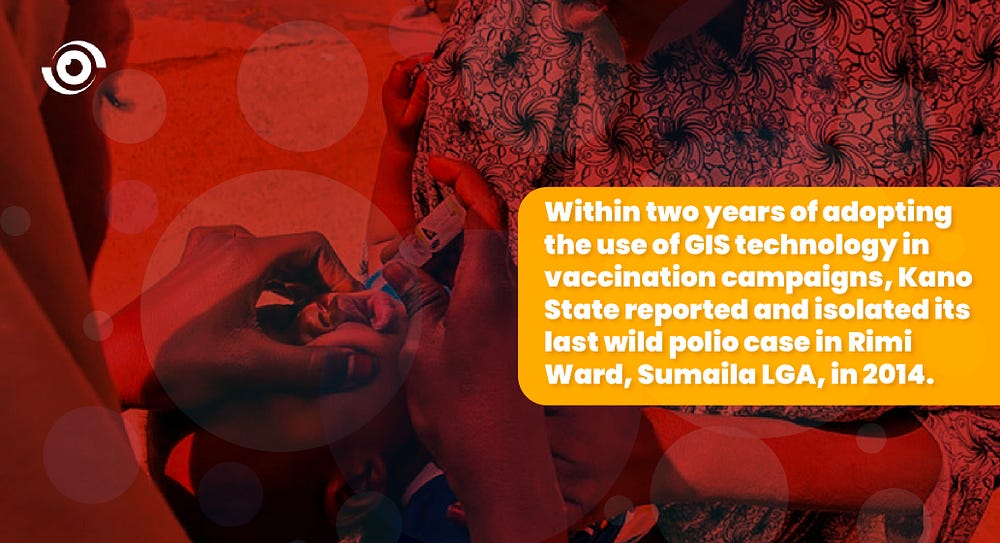
Two years after Kano State adopted the use of GIS technology in its vaccination campaigns, in 2014, the state reported and isolated its last wild polio case in Rimi Ward, Sumaila LGA. Dr. Shehu Abdullahi, the Kano State Immunisation Officer (SIO), believes that the use of GIS mapping contributed to this remarkable feat.

Maps, efficient planning, and effective implementation
“The programme aims to increase accountability in vaccination campaigns and improve access to services by providing updated and “accurate” information on settlements and population.” Nazir Halliru, Country Manager, GRID3 Nigeria
Five innovative solutions were put in place to achieve the programme objectives: GIS ward maps, a geospatial tracking system (GTS), a microplanning tool, tally sheet, and daily implementation plan (DIP) template. The DIP template includes entries such as the names of the settlements and an estimated number of residents; the number of people to vaccinate, the date of coverage; logistics; and places to visit.
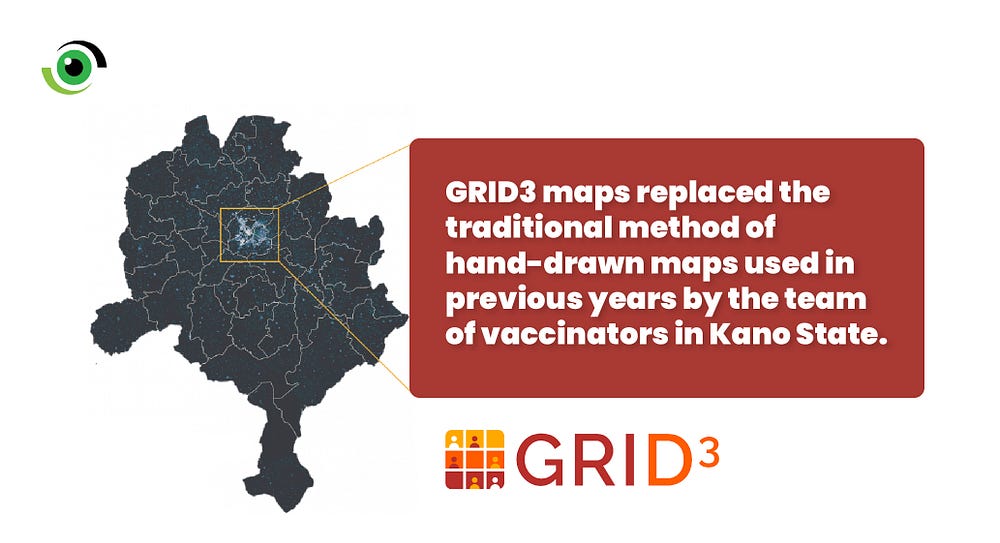
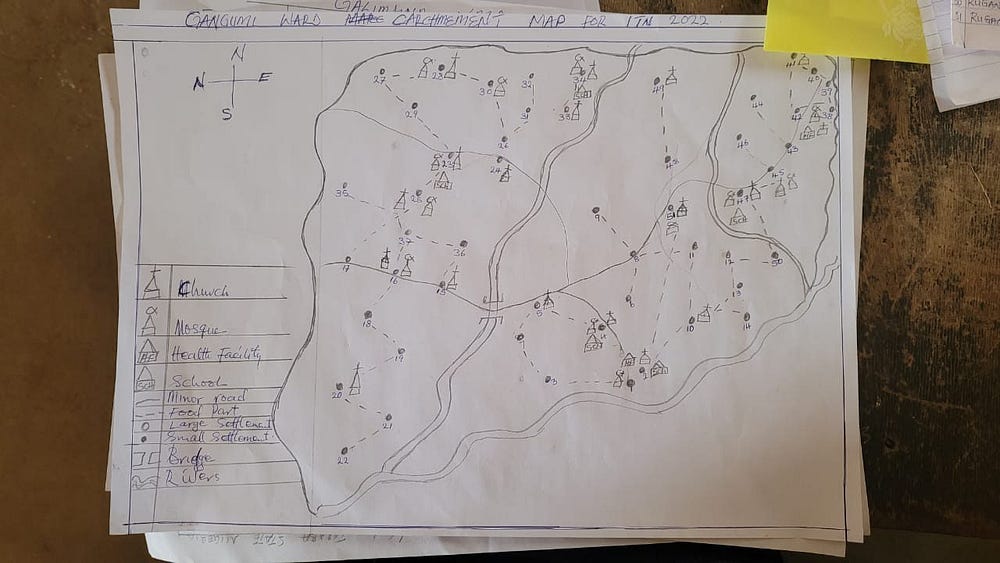
Using statistical models based on satellite imagery, data from an estimated number of settlements, buildings and population within 100 by 100-meter grid cells, maps were produced. The maps grouped settlements within a one-kilometer radius of one another and were useful in polio and non-polio campaigns throughout the state, replacing the traditional method of hand-drawn maps.
The vaccination teams use the information provided by the maps to populate the DIP templates, during every round of community visits.
Rabiu Muktar, a cold chain officer, said the microplanning tool has been very useful because it enables him to efficiently allocate vaccines and other resources to the vaccination teams to ensure that all target populations are reached during campaigns.

Improved coverage and staff performance tracking
Dr. Abdullahi revealed that prior to the GIS mapping intervention, data falsification was common, leading to a lot of wasted vaccines. “In recent campaigns in Kano, we have recorded a massive improvement in coverage,” he said, adding that “with each campaign round, coverage of the target population of children under the age of one has increased significantly to approximately 3 to 4 million infants.”

A vaccination team is made up of a team supervisor, a vaccinator, and a community leader. At each household they visit, the supervisor uses the DIP template to ask five crucial interpersonal communication (IPC) questions, including, number of children in the household, their whereabouts, and their vaccination status. If the children are present, the vaccinator would administer the vaccine by administering two drops orally; otherwise, the house will be marked for a return visit. The team supervisor uses the tally sheet to record the number of children who have been vaccinated.
Team supervisors are equipped with a mobile phone with GTS installed to track their movements between households. The device records the team’s real-time location at two-minute intervals. During the polio campaign, the tracker provided daily updates on the locations, where vaccinations were administered. At the end of each campaign activity, the ward focal person presents the GTS records to the local immunisation officer (LIO) at the LGA level who verifies the coverage of each ward and plans follow-up activities as needed to ensure full coverage of all areas.
The implementation of GIS technology in Kano and other states in Nigeria was a significant step towards improving the collection and analysis of geographic data in the country. Following the successful implementation in 2017, the Geo-reference Infrastructure Demographic Data for Development (GRID3) programme was launched to expand the use of GIS technology to the remaining 25 states and the Federal Capital Territory.
The GRID3 programme is a partnership between the Nigerian government, the World Bank, and other development partners. The programme aims to increase the availability and use of geospatial data to support evidence-based decision-making in health, education, agriculture, and other critical sectors of the economy.
All geospatial data generated by GRID3 from multiple data sources in Nigeria is currently managed by the National Space Research and Development Agency (NASRDA).
Supporting non-polio immunisation campaigns
In October 2022, GRID3 partnered with Nigeria’s National Malaria Elimination Programme (NMEP) to distribute insecticide-treated nets (ITNs) in Kano State. Previously, the registration process was done manually, which resulted in missing settlements. To improve the process, 484 ward-level maps were created by GRID3 and NMEP, indicating the number of households, ITNs required, and distribution hubs per health catchment area, ensuring adequate resource allocation to control malaria spread. GRID3 also helped with the COVID-19 vaccination in Kano State.
Digital microplanning training for trainers
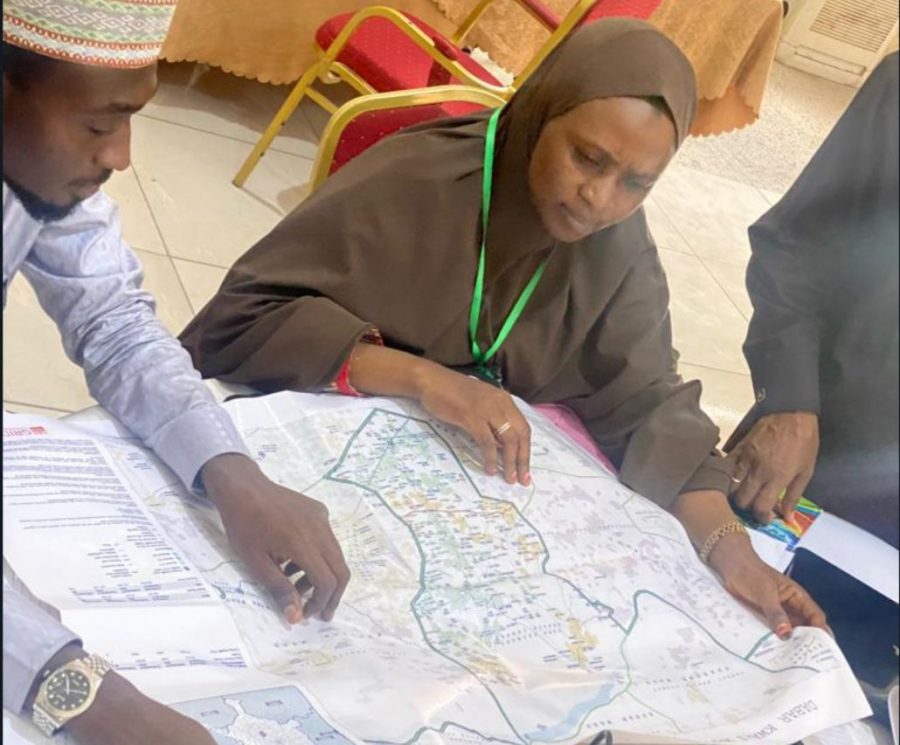
To strengthen the capacity of health officials to use the maps, GRID3 conducts two-day training for state-level health officials for each routine immunisation and SIA campaign round. The state is expected to replicate the training at the LGA and ward levels, however, it has been challenging scaling down the training effectively due to a lack of resources to deploy training personnel to all 44 LGAs in the state, Halliru revealed.
Taking ownership of the process
Although verified satellite imagery were used to create the maps, state officials noted that some settlements were not included. As a result, “we hold reconciliation meetings of the missing settlements prior to the implementation of the campaign with community leaders, ward focal persons, and team supervisors,” said Dr. Abdullahi. During the meeting, the names of settlements are called out and community leaders confirm which settlements fall under their wards. This way the baseline data for all the settlements is kept up to date with accurate information.
According to Halliru, other pieces of information on the ward-level maps produced by GRID3 aren’t 100% accurate. “What the team may have on their tally sheets and DIP templates may be more up to date than the maps. This is why the teams may also, at some point, have to update the maps we provided them with.” As a result, GRID3 hopes for greater participation from the state officials in providing feedback on the accuracy of the data they receive. This is critical because the accuracy of data generated by GRID3 is instrumental to the success of any immunisation campaign in the state.
Halliru disclosed that GRID3 is currently developing another tool, the Geospatial Microplanning Toolkit (GMT), which is designed to improve the ability of health workers across the country to collect, process, and disseminate high-quality geospatial data using digital data rather than paper maps.
Overall, the GRID3 programme is an important step towards achieving sustainable development in Nigeria. By improving the availability and use of geospatial data, the programme can support evidence-based decision-making and improve the effectiveness and efficiency of development interventions in the country.